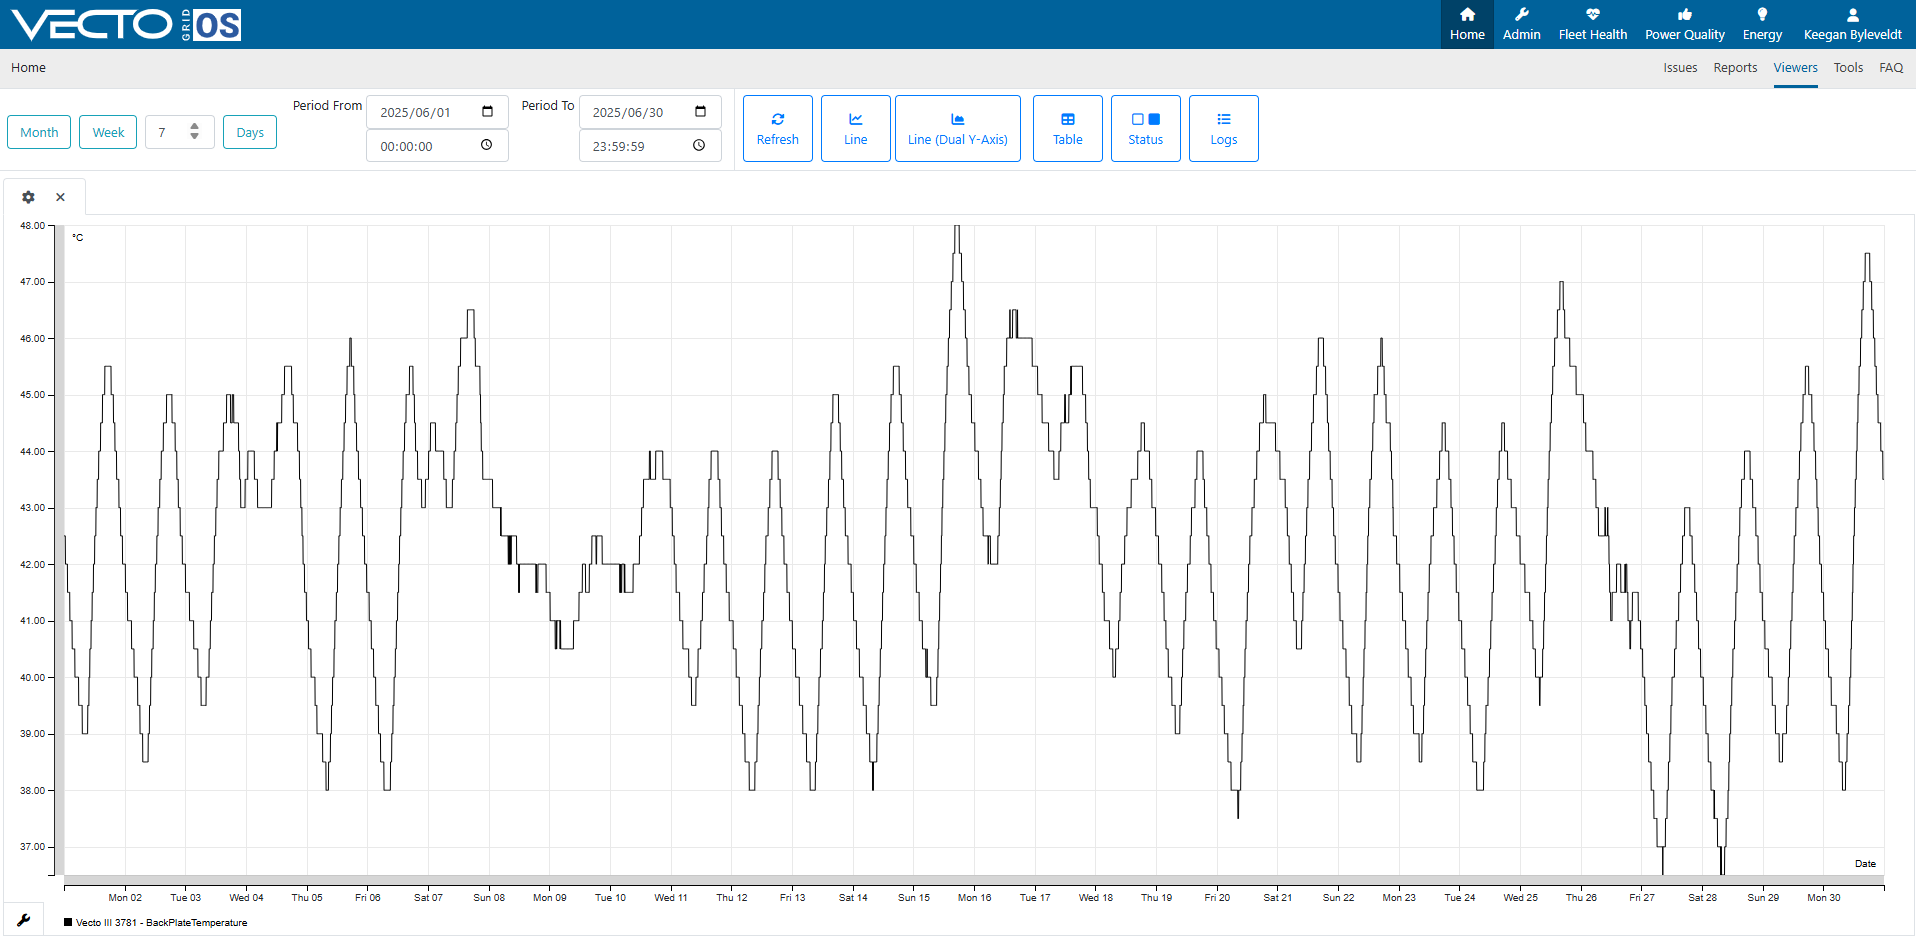
¶ Instrument Viewer
Instrument viewer allows you to view the status and parameter for each instrument registered to your Vecto Grid OS account. In this section you can create trend data for instrument level parameters.
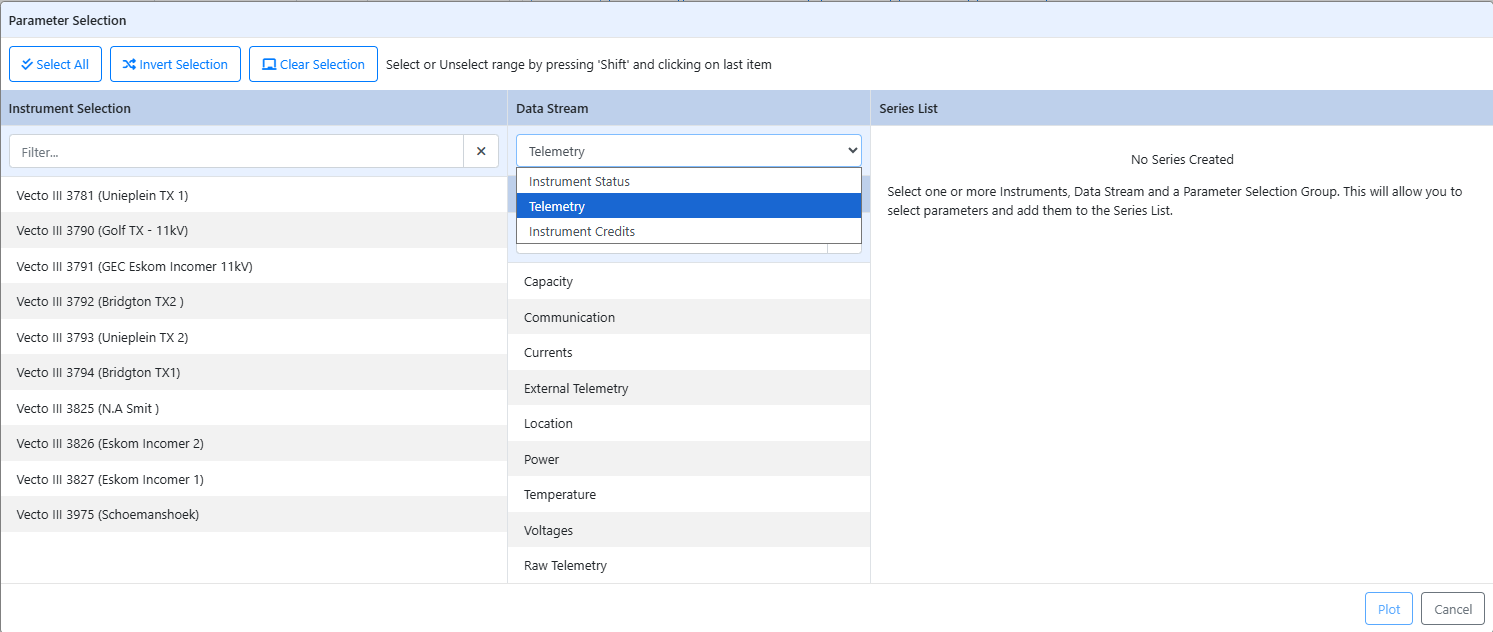
Once you have selected the instrument, as well as the Data Stream and Parameter, you are able to create a line chart containing the relevant data. Useful applications for this data include uptime graphs, as well as visualising the status of the instrument.