¶ Web Interface
VECTO Grid OS is an online application and executes within a web browser. It was tested extensively within Chrome on Microsoft Windows, on the Apple Mac and on Android. Most modern browsers should also be able to run VECTO Grid OS.
Similar to most native applications, VECTO Grid OS was designed as a single page application. To make use of all the screen real estate, press F11 while in the application . VECTO Grid OS was designed to scale to the screen format of the device it is accessed from. It will thus have a different look on a large desktop screen compared to a tablet. It can also be accessed from a mobile device, which will have a look and interface suited for touch screens.
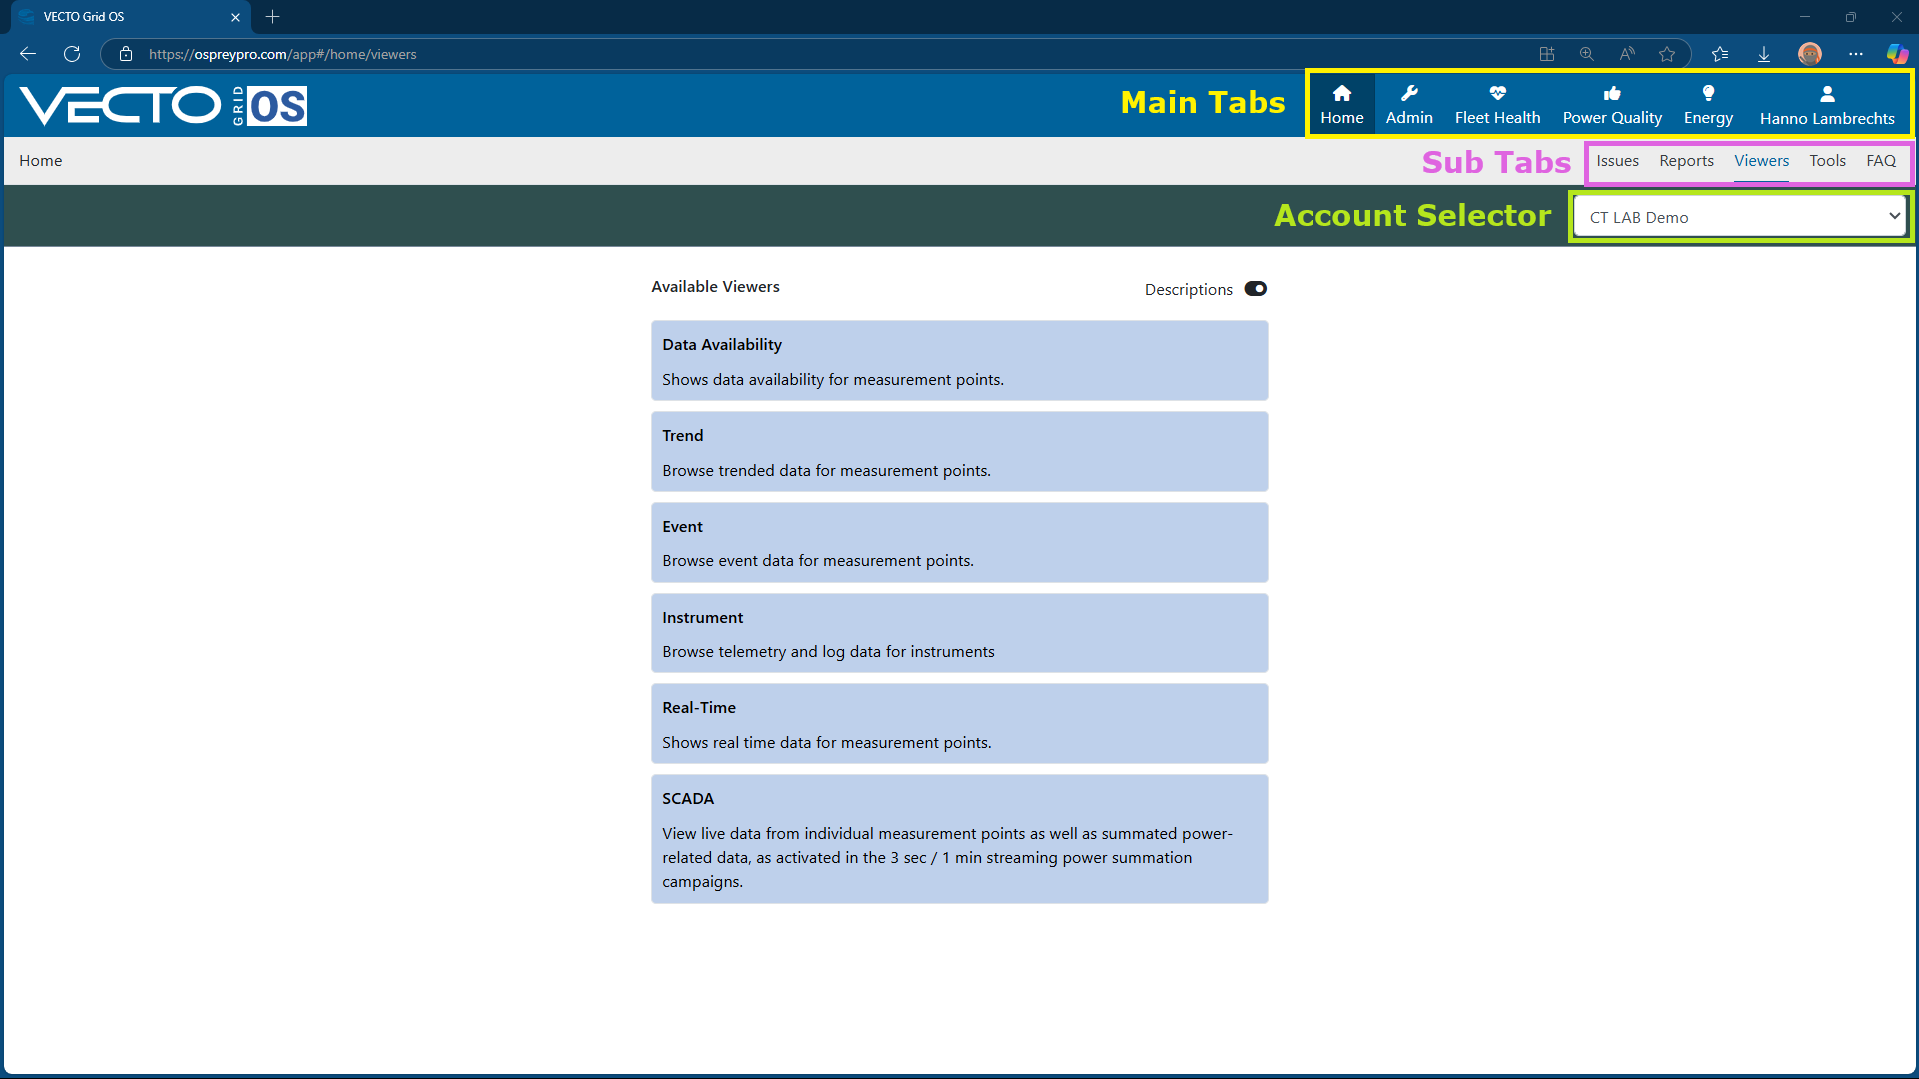
The VGOS web interface is organized into main tabs and sub-tabs to help you quickly find the tools and settings you need. Each main tab groups a perspective from which data/settings can be viewed, while sub-tabs provide more specific options within that category. See the screenshot below for the main tabs, sub-tabs, and account selector (only visible if you are a user on more than one account).
¶ Main Tabs
On the desktop web-browser application, the VECTO Grid OS logo is located at the top left of the screen, with the main functional areas on the top right. Each area is represented by the mains tabs. The following tabs are available:

Home: Information relevant to currently logged-in user, e.g. the number of open issues and whether push notifications may be delivered to the currently used device; also Reports requested by the user and Viewers granted to the user
Admin: Functionality to manage users, campaigns, measurement points, and Instruments. Access is restricted according to the user’s access rights
Fleet Health: Functionality to manage a fleet of instruments, subdivided into status pages.
Power Quality: Functionality to manage power quality for a network, subdivided into issues, issue history and dashboards.
Energy: Functionality to energy use of an account
User Profile: The user profile contains settings such as personal data, notification subscriptions and access rights.
¶ Detailed Interface Breakdown
In the section below a breakdown for each main tab and sub-tab are given.
¶ Home
On the Home tab all the reports, viewers and data export tools can be found.
 Home |
|
| Issues | Overview of fleet health and other notifications. |
| Reports | Ad hoc Reports: Users can create any report on a once-off basis. |
| Scheduled Reports: Reports can be generated on a recurring basis for automatic delivery by email to subscribed users. | |
| Report Comments / Notes: Capture comments for reports. | |
| Flag suspect Trend Data: Flag suspect trend data and recompute statistics. | |
| Viewers | Data Availability: This viewer shows data availability of data in the VGOS database per measurement point. |
| Trend: Browse all trended data. In this viewer all continuous recorded data can be viewed. | |
| Event: Browse all event and diagnostic data. In this viewer all event based recorded data can be viewed. | |
| Instrument: Browse all instrument or devices specific related data, such as telemetry and log data. | |
| Real-Time: This viewer shows real-time data snapshot per measurement points. | |
| SCADA: This viewer can be used to plot data in real-time as it is recorded and downloaded to VGOS. | |
| Tools | Targeted Exports: Export a selection of data to multiple file formats for use in external systems. |
| Timed Recording: Manually trigger an event to be recorded. | |
| Snapshot: Record a snapshot of the network. Batch scheduled timed recording. |
¶ Admin
The Admin tab is only available to users with a "Fleet Manager" or "Account Administrator" role.
 Admin |
Users | Contains a list of users who have access to the account. Account users can be managed here. |
| Shares | Authorized users from one account can share data access to users of another account. Users with access to multiple accounts will be able to select the account that their current view applies to. | |
| Campaigns | Configure and activate campaigns. | |
| Measurement Points | Contains a list of measurement points on the account. Measurement points can be configured, added, attached, commissioned, and deleted here. | |
| Instruments | List of instruments on the account. Instruments can be added and configured here. | |
| Nodes | Network nodes can be created here for the calculation of technical losses | |
| Assets | Assets such as transformers can be added here with asset specific limits. Used for asset management reports. | |
| Tariffs | Add and manage tariff structures for billing verification. | |
| Supply Contracts | Setup supply contracts for billing verification. | |
| XTrigger | Setup XrossTrigger® groups for cross triggering. | |
| SLD | Load Single Line Diagrams and mark measurement points on the SLDs. | |
| Tags | Manage measurement point tags. | |
| Tools | User Defined Fields: Create and manage user defined fields that can be used to store additional information. | |
| User Defined Stream Parameter Types: Create and manage user defined stream parameter types that can be used to store additional information. | ||
| Targeted Deletes: Delete measurement point data per stream for a specified date range. |
¶ Fleet Health
On the fleet health tab the status of the entire fleet can be viewed. The configuration and repair status of individual instruments can be viewed, as well as the health of insturments,e.g. wheter the instruments are online, recording or sending data, connected to GPS, etc.
 Fleet Health |
|
| Dashboards | Current Fleet Status: Shows the overall health status of all active instruments with attached measurement points. |
| Instrument Repair Status: View instrument repair status and health status along with some telemetry data. | |
| Fleet Configuration Status: View current and historical measurement point configurations for individual measurement points. | |
| Tools | Targeted Meter Data Delete: Delete data from instruments. |
| Instrument Management: Low level instrument feature management. Change instrument spesific settings. | |
| Single Line Diagrams: View and edit single line diagrams. | |
| Firmware Upgrades: Manage instrument firmware upgrades. | |
| Installed Firmware: View current installed firmware ofr instruments. |
¶ Power Quality
The Power Quality tab, presents all the recorded data in a processed manner which makes it easier to put the large amounts of data in context.
 Power Quality |
|
| Issues | Similar events and power quality issues from different measurement points in the fleet are grouped together into an "issue". See and manage latest issues here. Only open issues can be seen here. |
| Load Shedding | Shows all issues that are automatically tagged as loadshedding/rolling blackout. Relevant campaign must be activated. |
| Issue History | Search for previous issues from specific measuring points and for specified periods, previously closed issues can be viewed here. |
| Dashboards | Current Enterprise Power Quality Status: Shows current state of power quality for all active measurement points. |
| Enterprise Quality Performance: Shows normalized indices for all power quality parameters over a selectable period for all active measurement points. Shows how measurement points are performing relative to each other over time. | |
| Network Disturbance Summary: Shows an overview of event distributions, per network site. | |
| Tools | User Defined Issues: Manage user defined PQ Issues. |
| Issue Management: Low level tool for management of issues. | |
| Manage Issue Tags: Manage issue tags and tagging. | |
| Issue Cause: Browse issues attached to cause. |
¶ Energy
The Energy Tab shows power factor related parameters. Some 3s data will also be incorporated here. TBD
 Energy |
|
| Issues | For Future Use |
| Issue History | For Future Use |
| Dashboards | Power Factor: Identify power factor irregularities by inspecting the daily average power factor per measurement point for the past 30 days. |
| Power Factor Status: View power factor and demand status for the past 6 hours. | |
| Tools | Provide Billing Data: Manage client provided billing data required for the calculation of non-technical losses. |