¶ Event Viewer
¶ Events overview
When recording events, ensure the correct monitors are activated to ensure you are able to access the event data.
Once you have selected the Event Viewer, a window similar to the one found in the Trend Viewer is displayed.
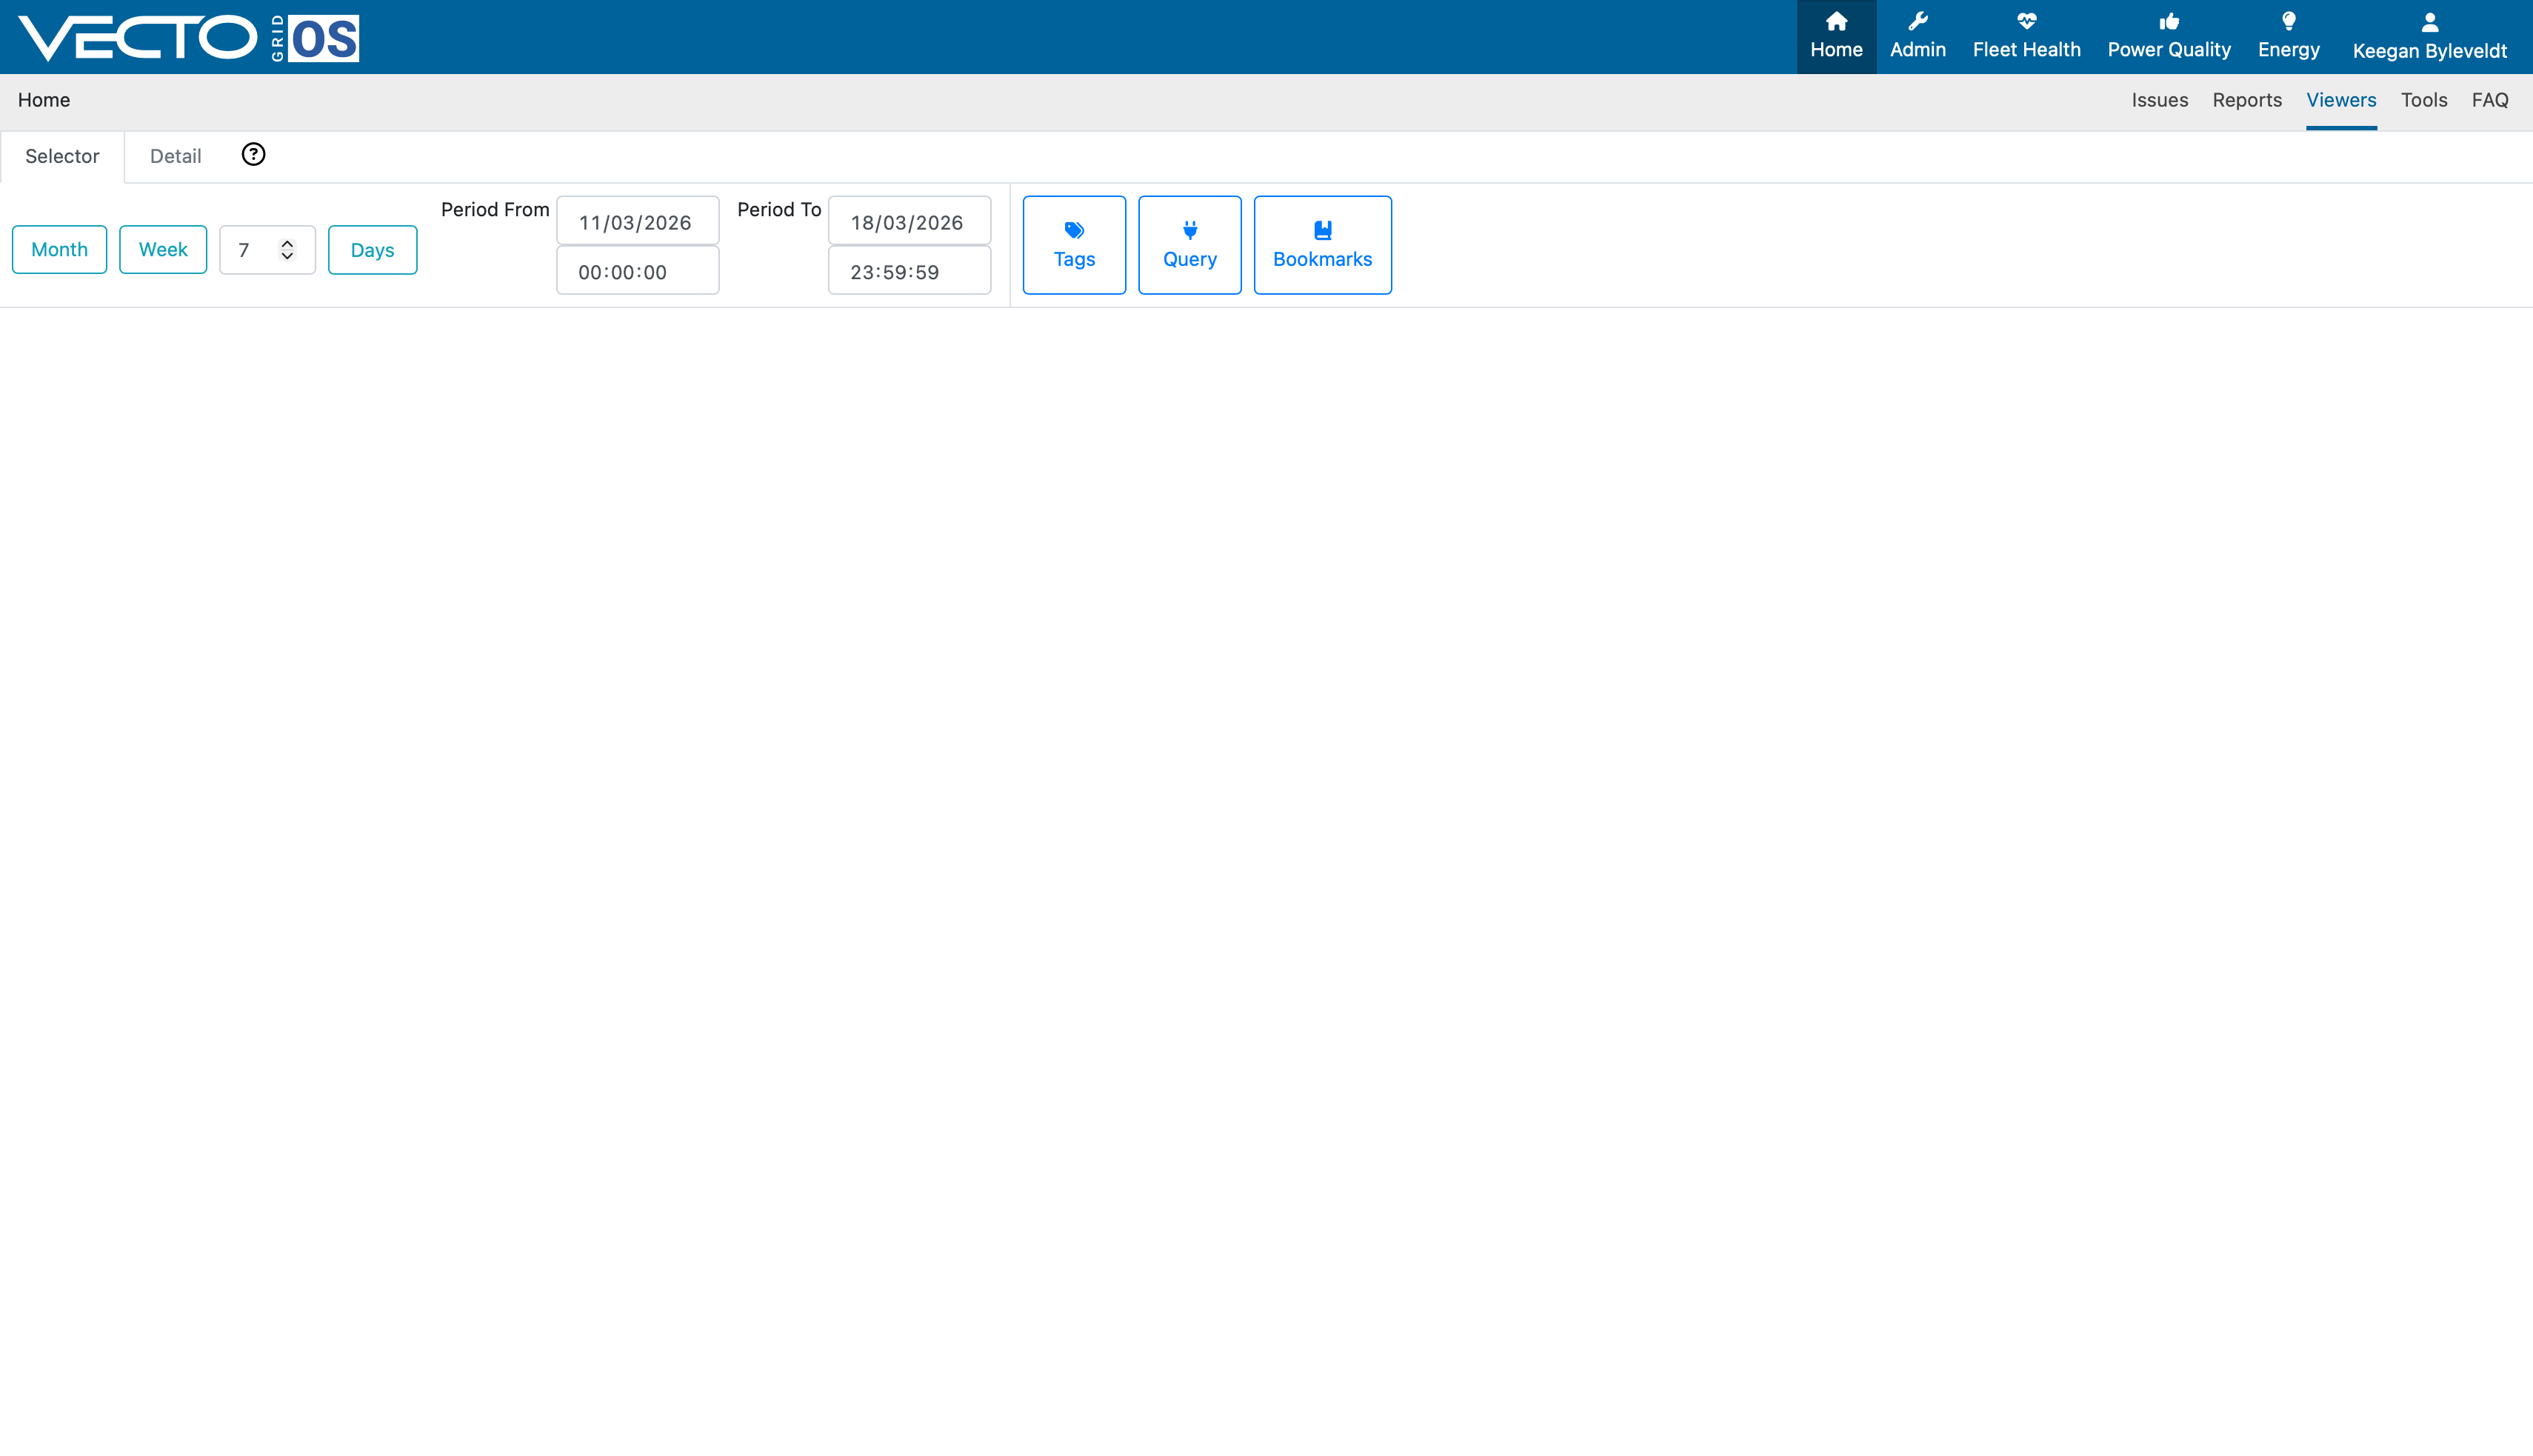
A popup will appear prompting you to select the measurement points you want toe query events for.
After selecting the appropriate measurement points, Vecto Grid OS will provide you with all events for the selected period and measurement points.
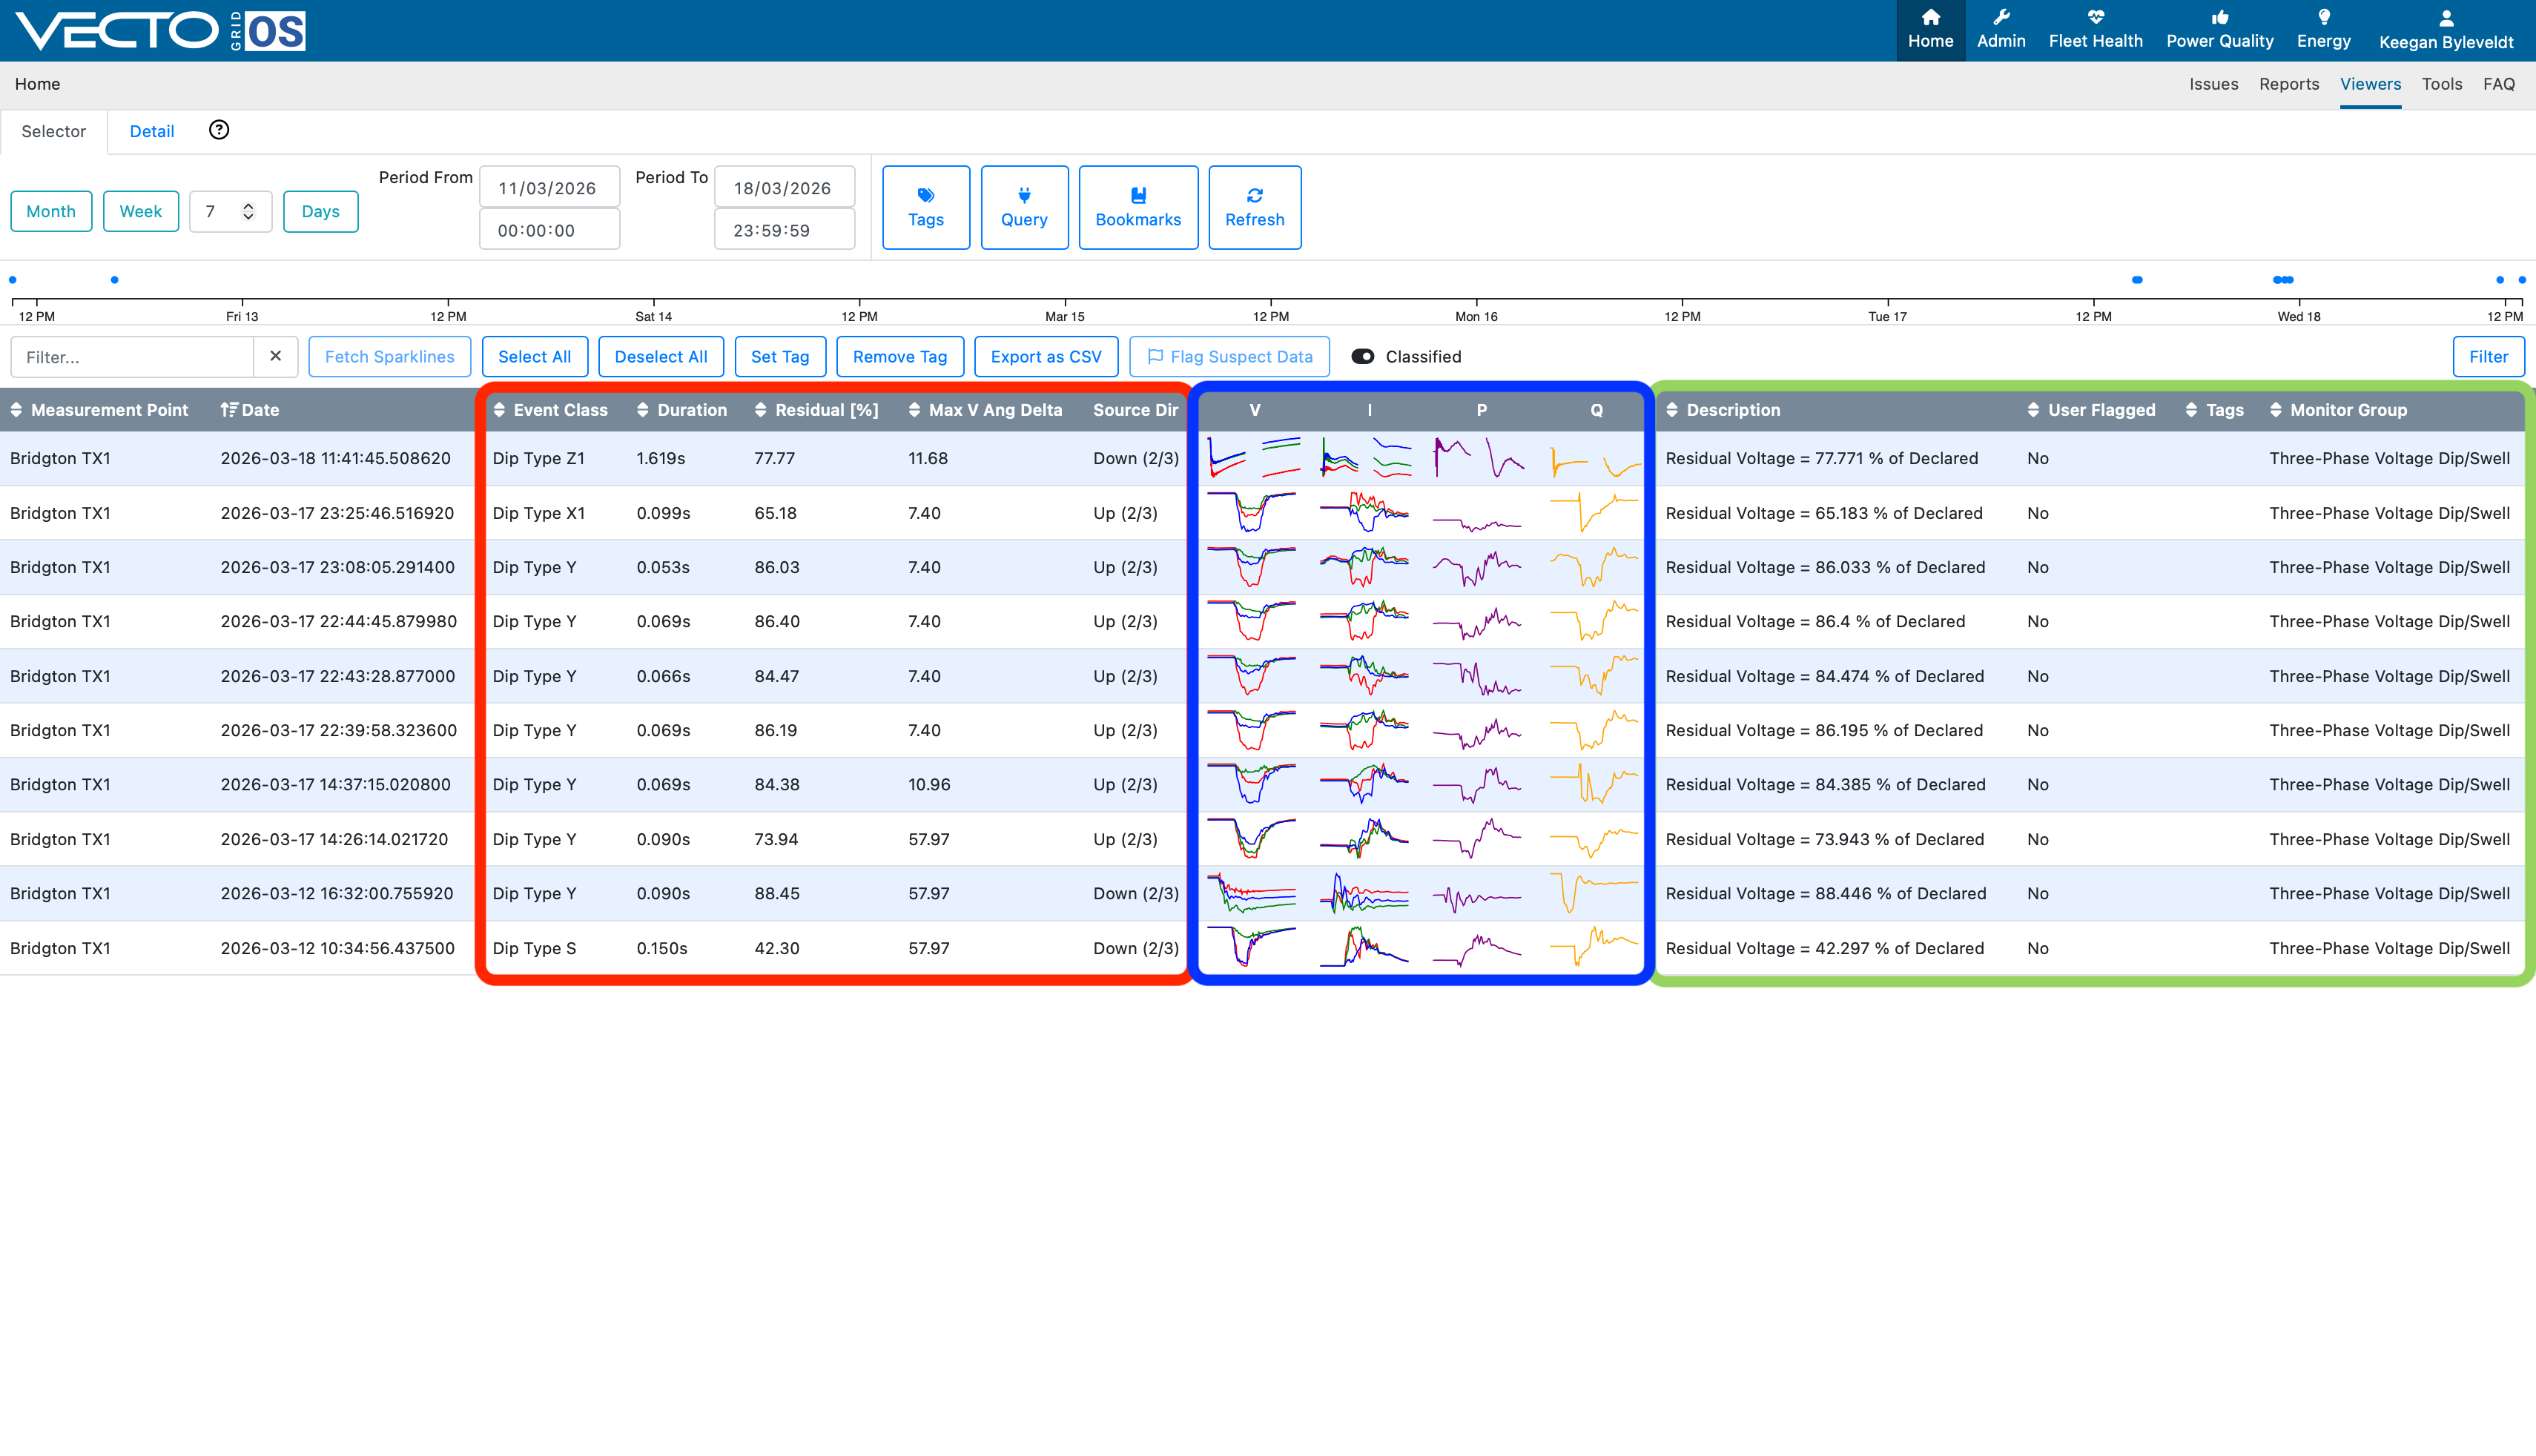
First, shown in the red box, the events are categorised and their duration and residual voltage is given. This is useful to understand what type of dip it is, and why it is classified as that specific type of dip. The dips in this image are classified according to NRS 048-2.
The blue box contains spark lines of the voltage, currrent, active and reactive power. These parameters aid in showing you, at a glance, how the plant was affected for the duration of the dip.
The green box provides you with a short description, as well as information of which monitor was triggered. All monitors will report their events in this section. Refer to Measurement Point Setup for more information regarding the different monitors.
¶ Detailed events view
Once you have selected the desired event, you can navigate to the "Detail" tab on the top of the page, which enables you to view more detailed information, similar to the information shown in the blue box of the previous image.
Upon selecting detailed view, the following information is of importance:
- Understand what parameters you want to view
- Understand the resolution at which you want to view the data
In most cases you will view the cycle data, as it provides you with information such as the dip durtion and residual voltage. In cases where faults occur, you will want to view 50 kHz waveforms to find out whether voltages and/or currents were in phase, indicating line-line faults.
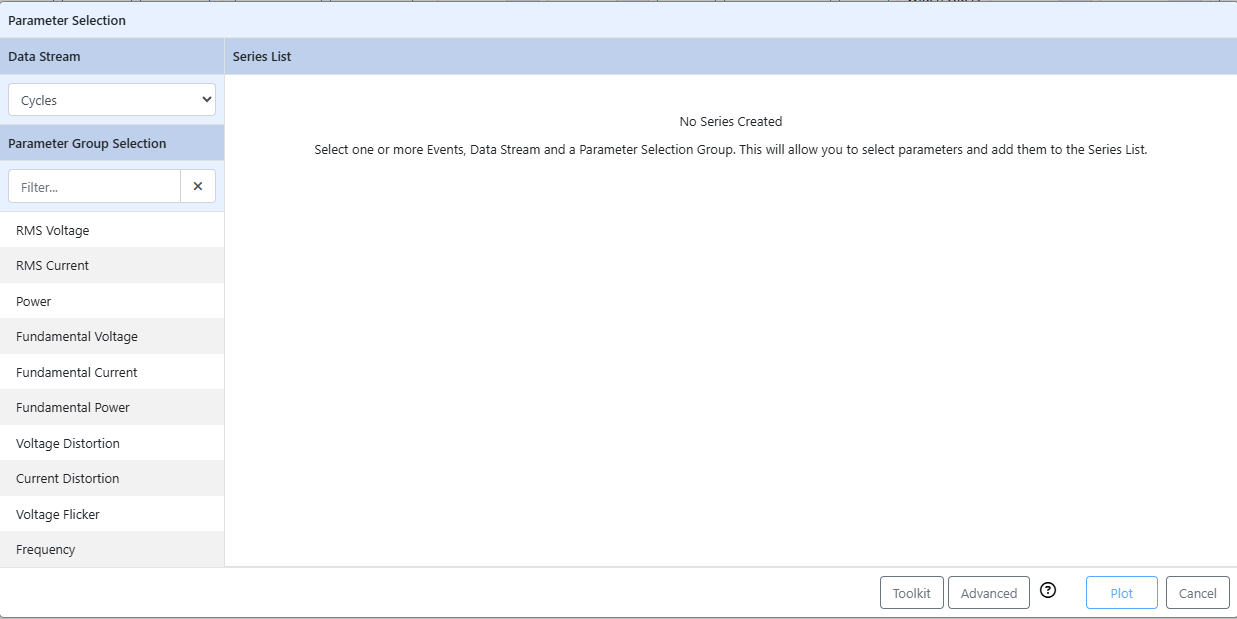
In the parameter selection window you will be able to choose the desired parameter, as well as the desired Data Stream. As explained above, it is important to understand what you want to see before choosing the Data Stream and parameter.
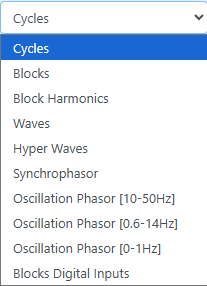
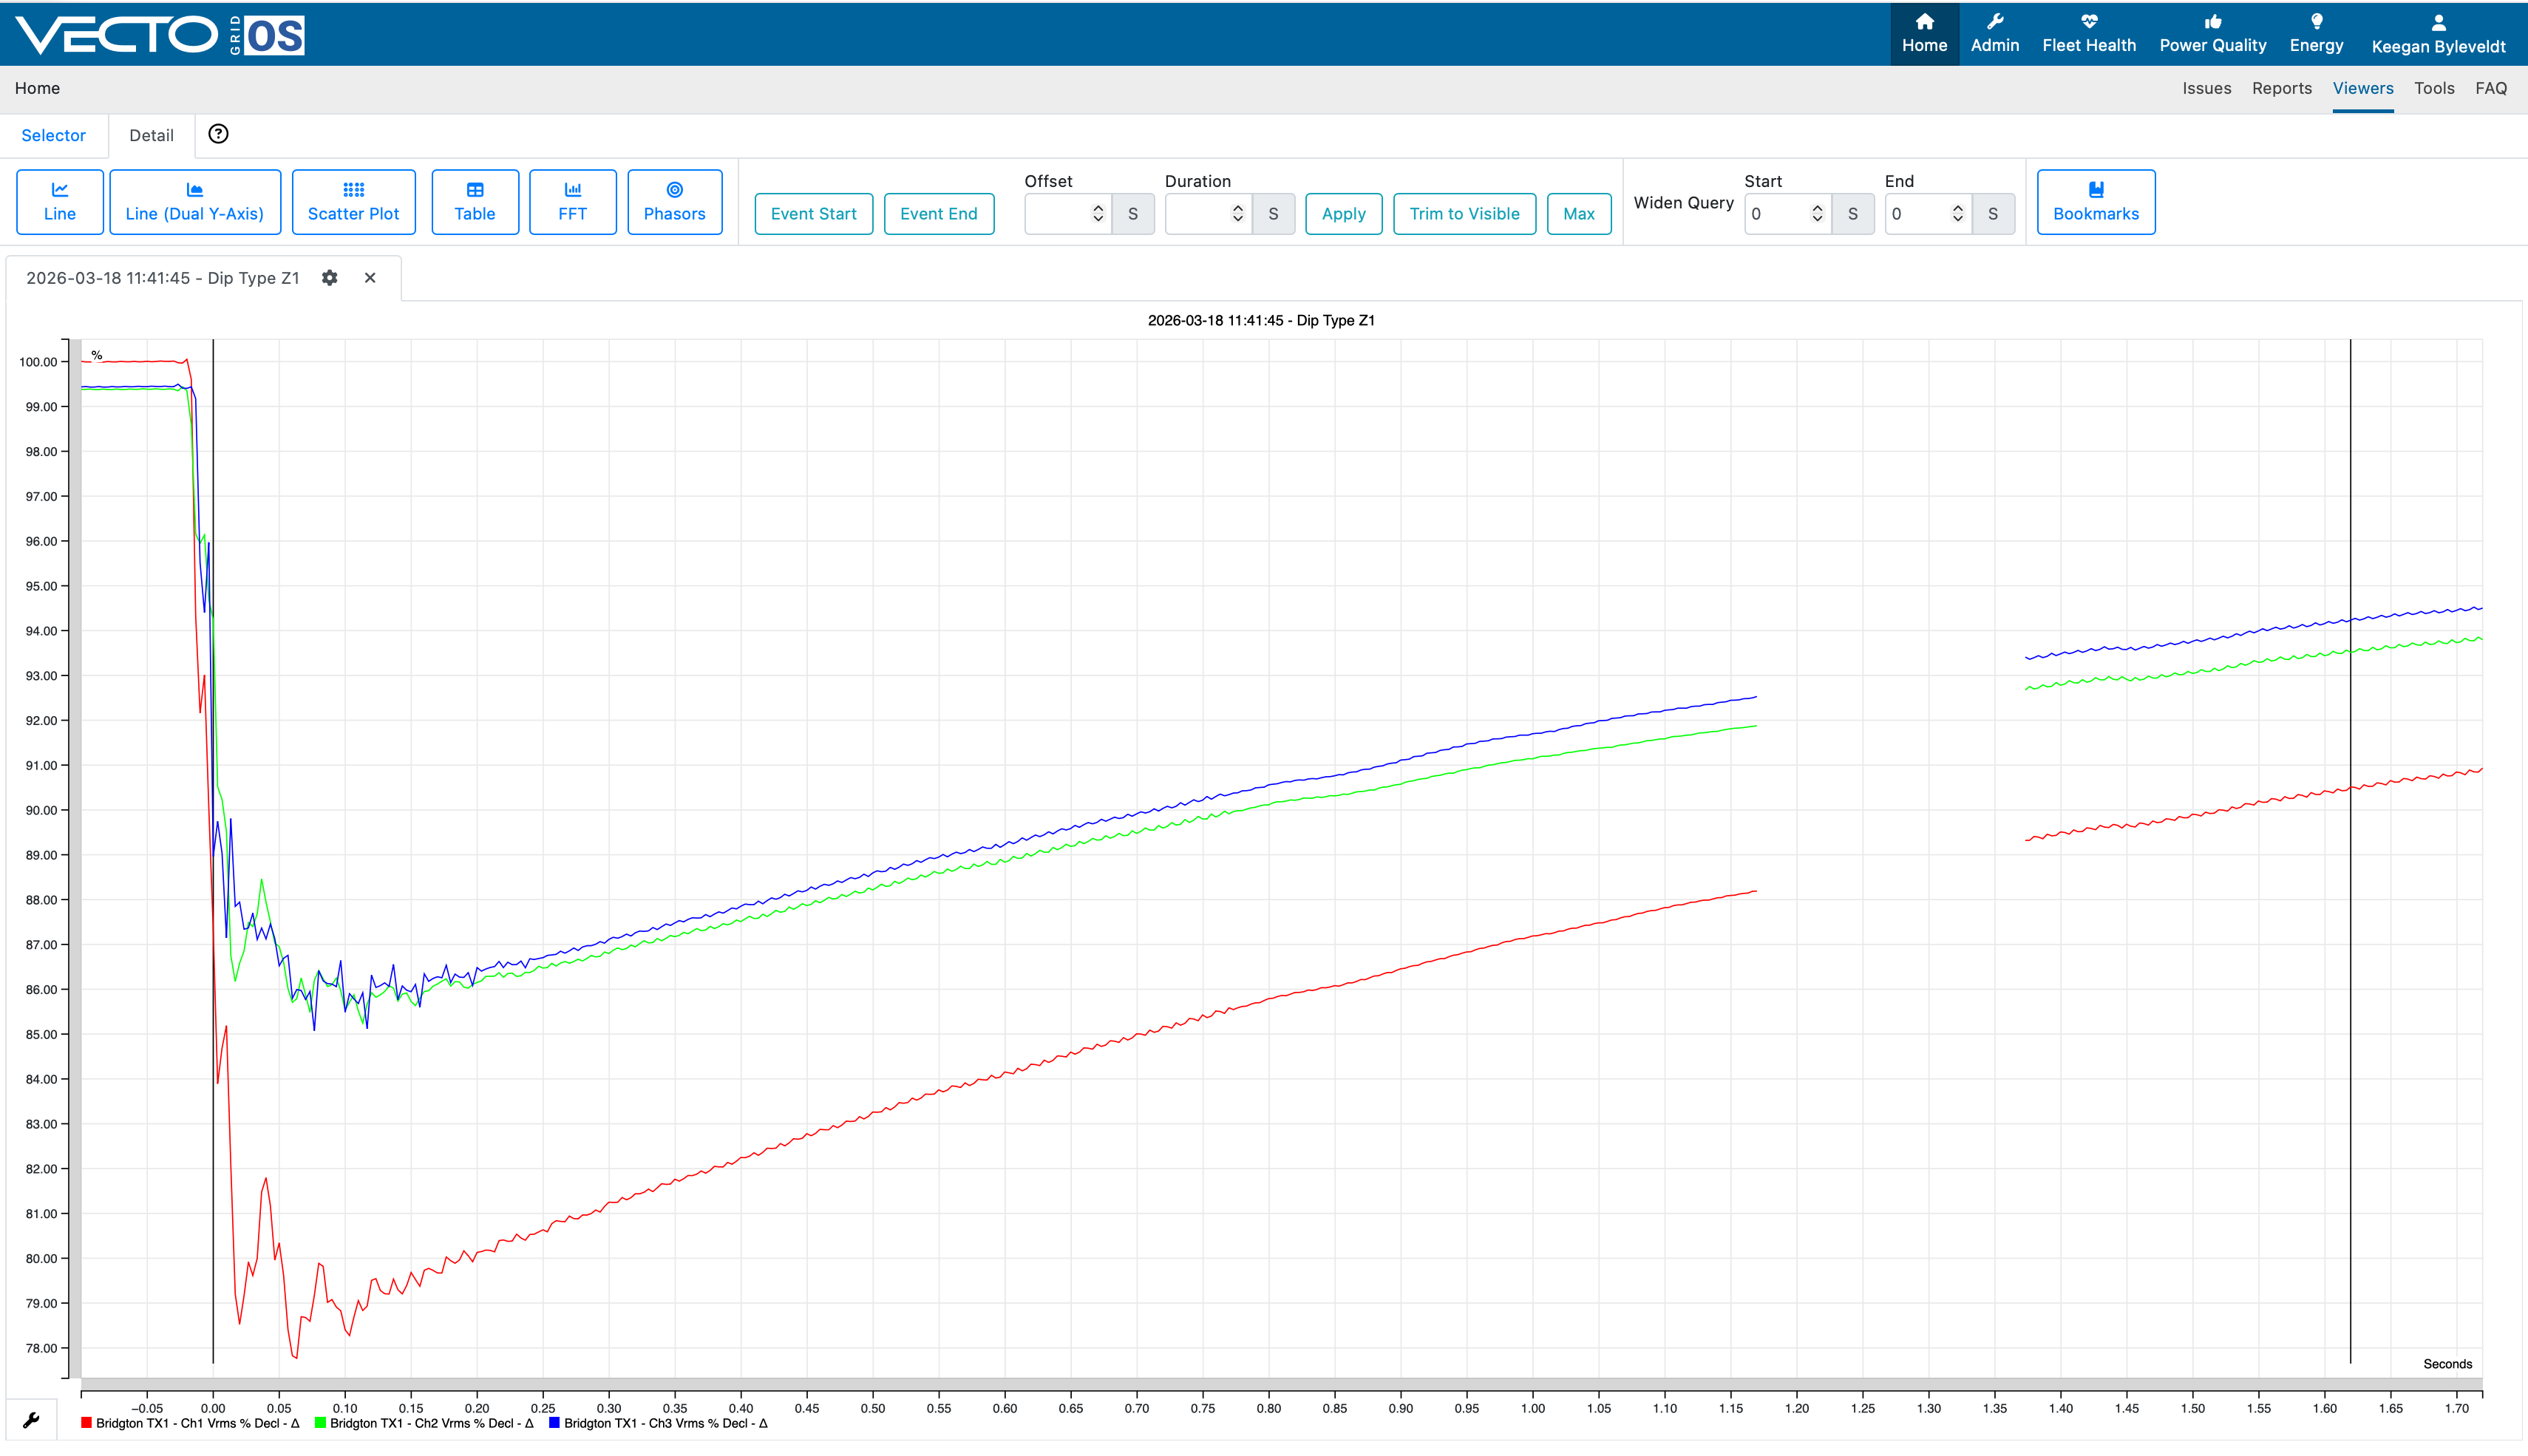
Once you have selected the desired Data Stream and Parameter, you are able to view the parameter in more detail. In the case below weare able to view the phase voltage cycle data.
Phasor view shows how the voltage / current phasor is affected during the event. It is useful to show phase jumps during fault conditions, such as conductors touching each other.